This post introduces Covid Calculator, a small visual tool for exploring rough estimates of the impact of Covid-19 under different assumptions.
The tool is available here:
The purpose of the tool is not to make precise forecasts, but to make the underlying assumptions visible. Users can change infection rates, age-specific fatality rates, and country-specific demographics, and then inspect how these choices affect estimated deaths, years of life lost, and country-level risks.
The tool began as a simple bar chart for mortality by age. I then added country selection, age structure, several fatality-rate assumptions, estimates of years of life lost, and simple country-level visualizations. The current version is simplified and focuses on interactive visual exploration.
Disclaimer
I am not a health expert or an epidemiologist. This tool is only a visualization of simple calculations under user-selected assumptions. It should not be used for medical, public-health, or policy decisions. For health, safety, and medical emergencies or updates on Covid-19, consult official public-health sources such as the World Health Organization or your local public-health authority.
Introduction
At the time I first made this tool, the impact of Covid-19 was still highly uncertain. Estimates varied across countries, data sources, fatality-rate assumptions, and assumed infection rates. This made it difficult to compare scenarios in a simple way.
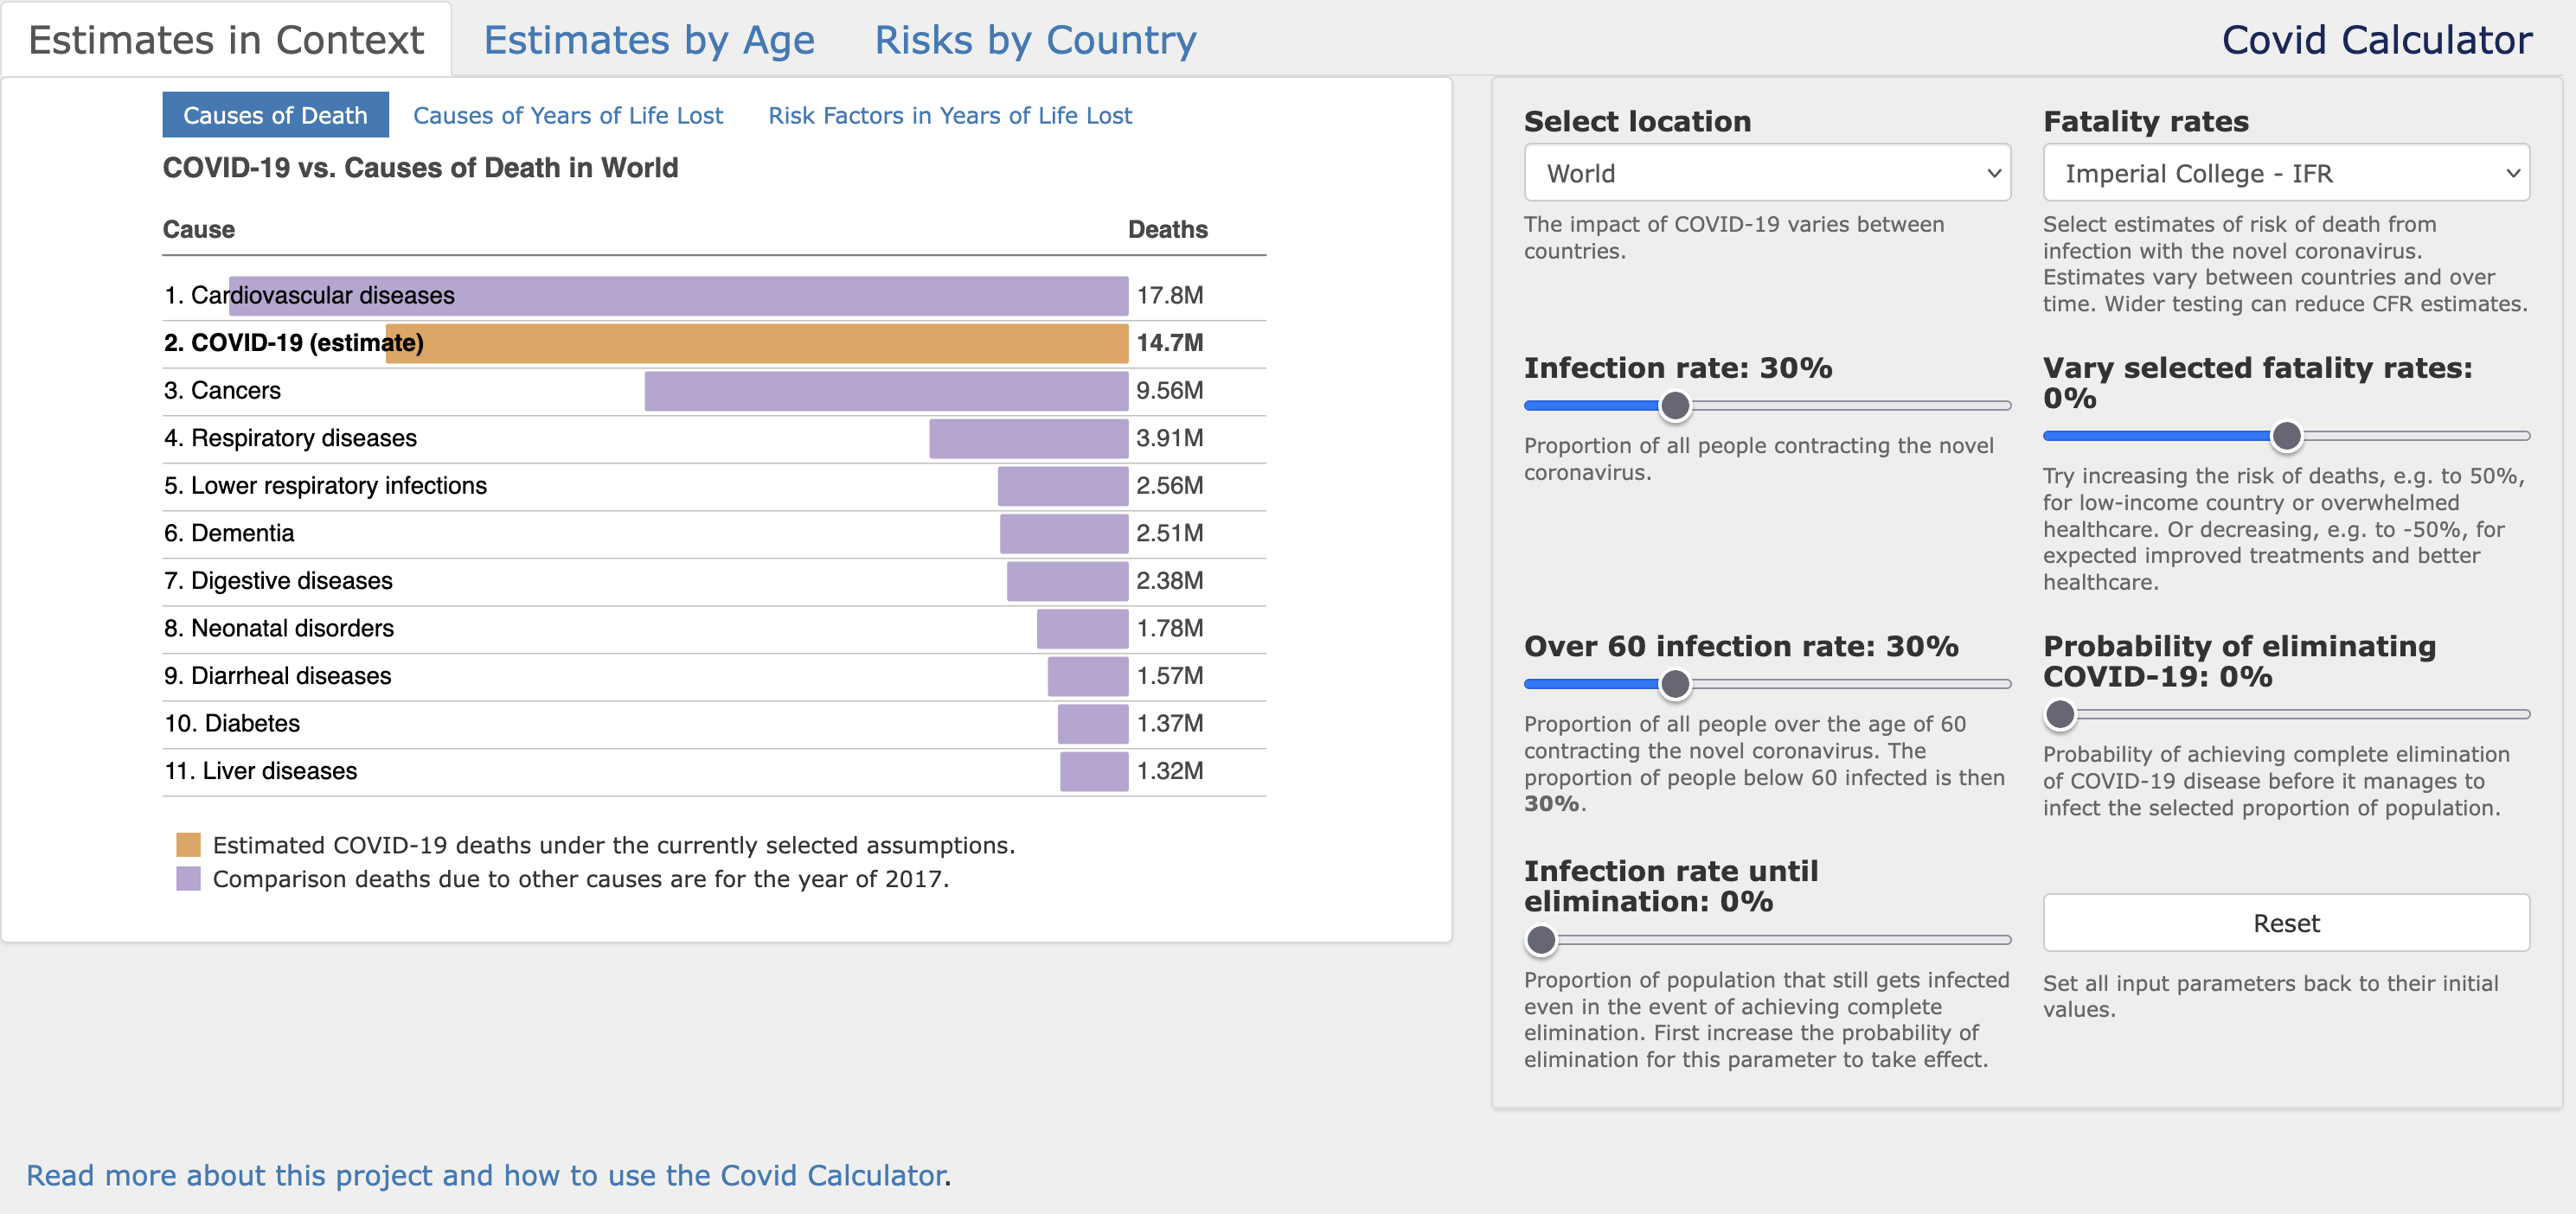
The Covid Calculator was my attempt to organize some of this information into a visual interface. It lets the user choose a location, select fatality-rate estimates, and modify assumptions such as the infection rate or the probability of eliminating Covid-19 before it reaches the selected infection level.
The calculations are intentionally simple. They are useful for understanding the role of assumptions, but they should not be interpreted as forecasts.
Age structure
Let $G$ denote the set of age groups:
\[G = \{ \text{0-9}, \text{10-19}, \ldots, \text{70-79}, \text{80+} \}.\]For a selected location, the population size in age group $g$ is denoted by
\[N(g) = n(\text{people in age group } g).\]The total population size is
\[N = \sum_{g \in G} N(g).\]The calculator uses age-structure data from (Pyramids, 2020). This matters because Covid-19 fatality risk is strongly age-dependent. A country with an older population can have a substantially different expected number of deaths than a country with the same total population but a younger age distribution.
For some calculations, I split the age groups into two parts:
\[\begin{aligned} G_{<60} &= \{ \text{0-9}, \text{10-19}, \ldots, \text{50-59} \}, \\ G_{60+} &= \{ \text{60-69}, \text{70-79}, \text{80+} \}. \end{aligned}\]The proportion of the population over 60 is
\[d_{60+} = \frac{ \sum_{g \in G_{60+}} N(g) }{ N }.\]Fatality rates
The tool distinguishes between two related quantities.
The infection fatality rate $\text{IFR}$ is the proportion of deaths among all infected individuals:
\[\text{IFR} = \frac{ n(\text{deaths}) }{ n(\text{infected}) }.\]The case fatality rate $\text{CFR}$ is the proportion of deaths among confirmed cases:
\[\text{CFR} = \frac{ n(\text{confirmed deaths}) }{ n(\text{confirmed infected}) }.\]The default fatality-rate estimates are age-specific infection fatality rates from (N Ferguson & et al., 2020). Users can also choose alternative fatality-rate estimates.
There is an important difference between $\text{IFR}$ and $\text{CFR}$. Confirmed cases are usually only a subset of all infections, especially when testing is limited. Therefore, $\text{CFR}$ can be substantially larger than $\text{IFR}$.
In the calculator, let $\text{FR}^{*}(g)$ denote the selected fatality-rate estimate for age group $g$. Users can increase or decrease these rates by a percentage $F$. The adjusted fatality rate is
\[\text{FR}(g) = \text{FR}^{*}(g) \left(1 + \frac{F}{100}\right).\]Proportion infected
Let $H$ denote the selected proportion of the population that becomes infected:
\[H = \frac{ n(\text{infected}) }{ N }.\]The interface also allows a separate infection rate for people over 60. If $H_{60+}$ is the infection rate among people over 60 and $H_{<60}$ is the infection rate among people below 60, then the total infection rate decomposes as
\[\begin{equation} H = (1 - d_{60+}) H_{<60} + d_{60+} H_{60+}. \label{eq: decomposition} \end{equation}\]This allows simple scenarios in which the infection rate among older individuals is different from the infection rate in the rest of the population.
Probability of eliminating Covid-19
The calculator also includes a simple parameter for the probability of eliminating Covid-19 before it infects the selected proportion of the population.
Let $A$ be the event that Covid-19 is eliminated before reaching infection rate $H$. Let
\[E = \Pr(A).\]Let $U$ denote the infection rate reached in the event of elimination. The expected number of infected individuals in age group $g$ is then approximated by combining the two scenarios:
\[\mathbb{E} \left[ n(\text{infected in age group } g) \right] = (1 - E) N(g) H_{*} + E N(g) U_{*}.\]Here, $*$ is either $<60$ or $60+$, depending on the age group.
This is a crude model, but it gives a way to visualize how much estimates change if the disease is eliminated before reaching the selected infection rate.
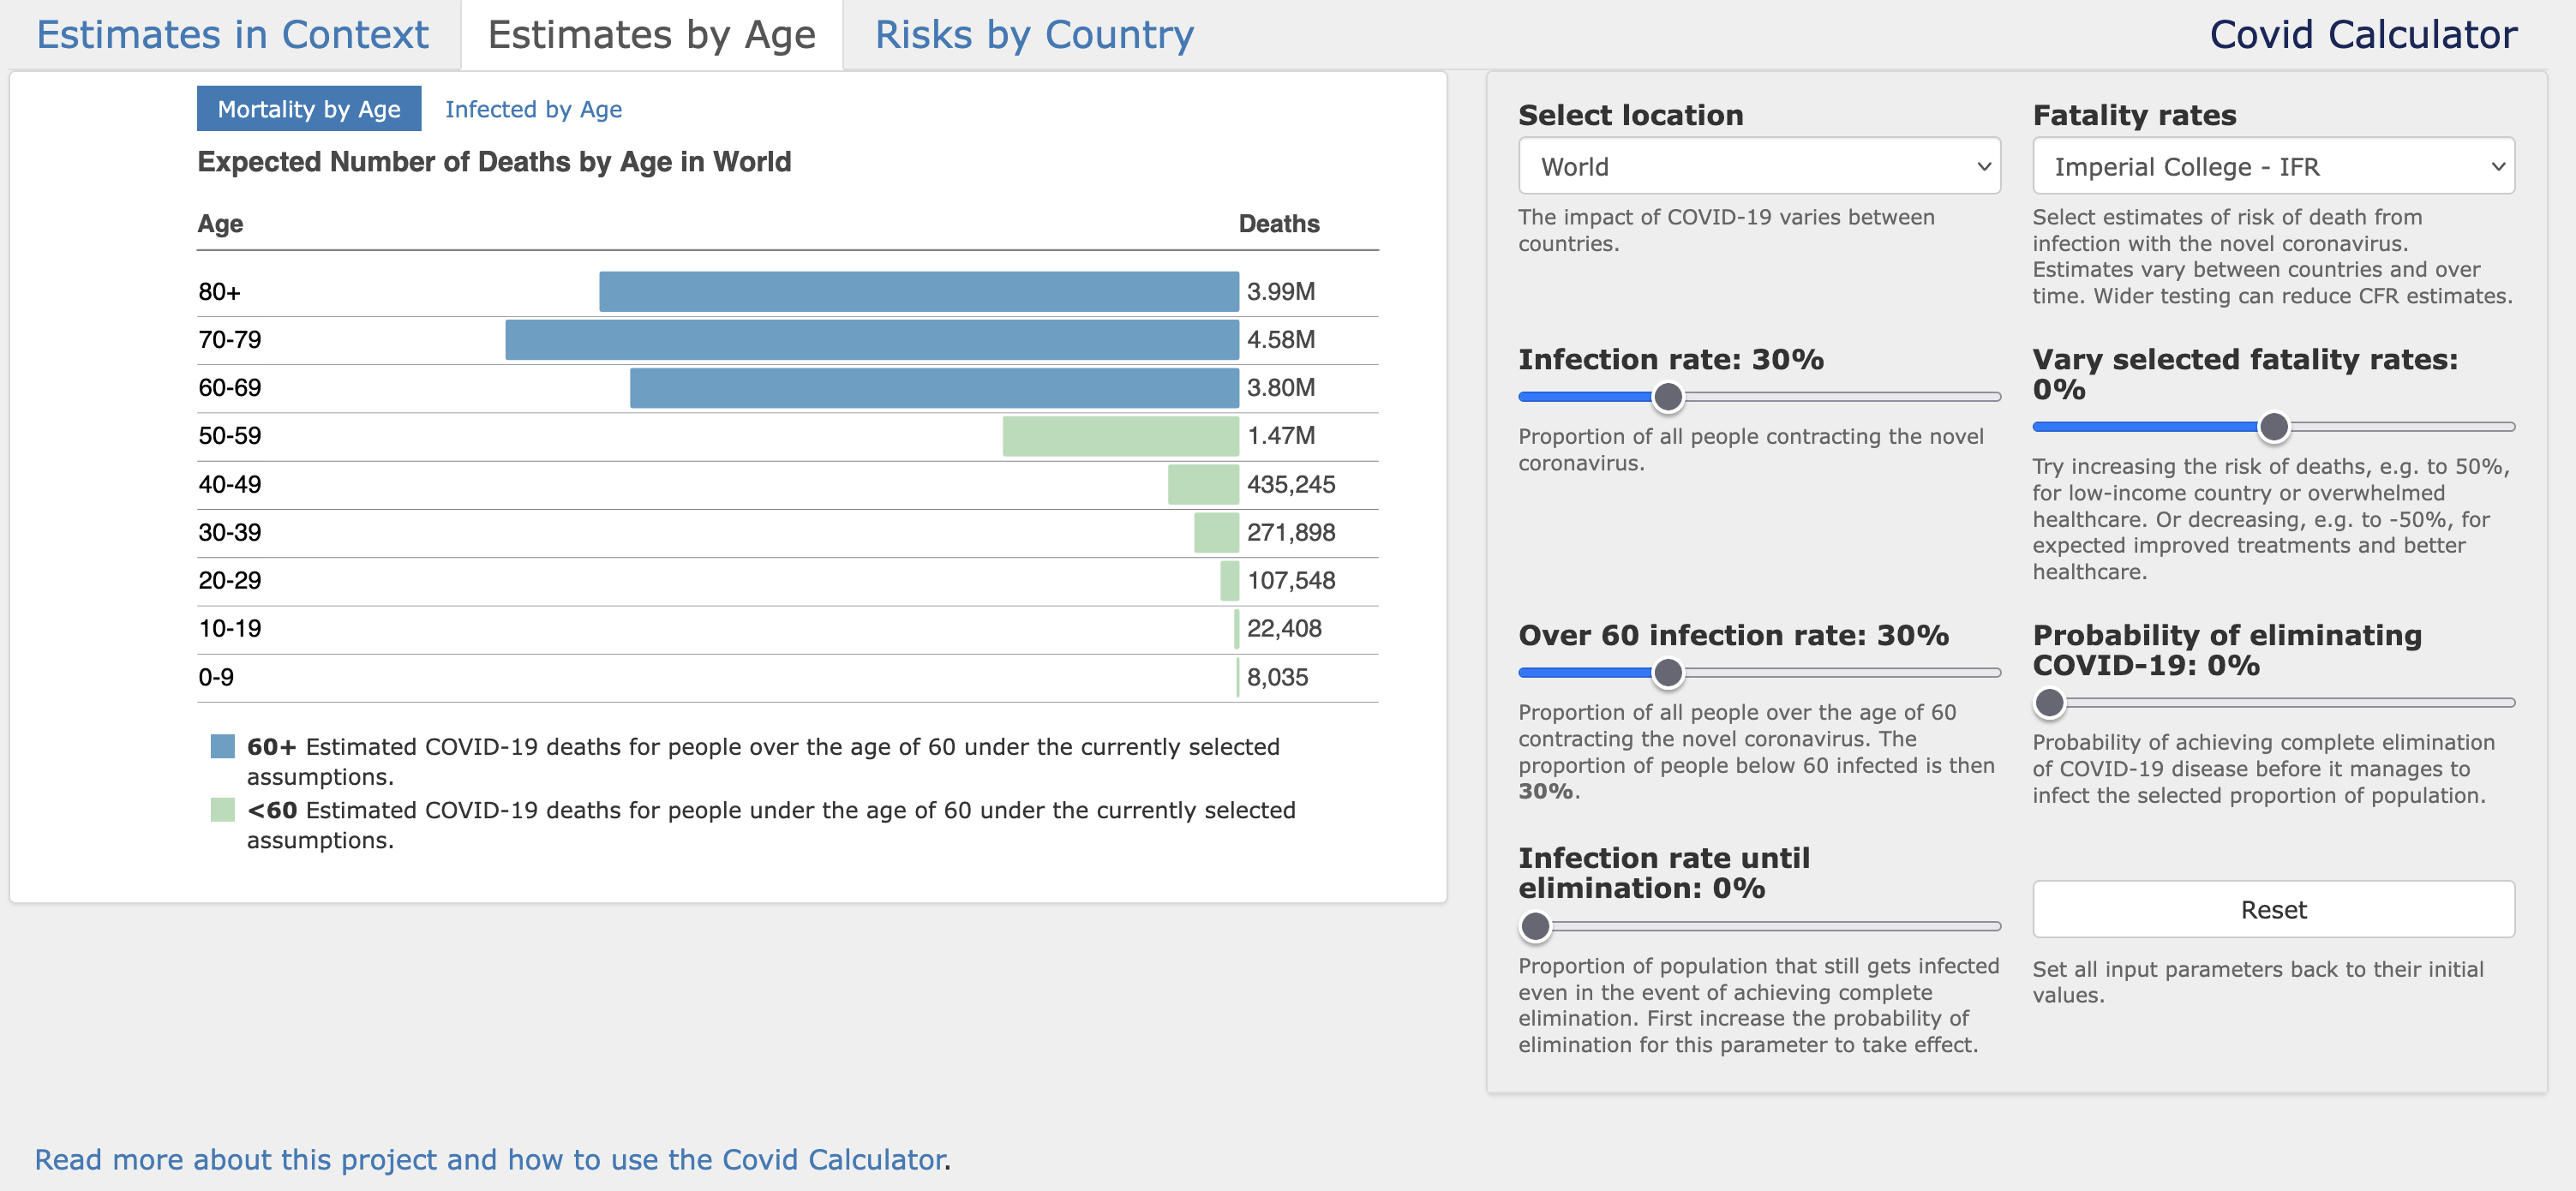
Expected number of deaths
The expected number of deaths in age group $g$ is estimated as
\[\mathbb{E} \left[ n(\text{deaths in age group } g) \right] = \mathbb{E} \left[ n(\text{infected in age group } g) \right] \text{FR}(g).\]The total expected number of deaths is the sum over age groups:
\[\mathbb{E} \left[ n(\text{deaths}) \right] = \sum_{g \in G} \mathbb{E} \left[ n(\text{deaths in age group } g) \right].\]The bar charts in the tool display these estimates either by age group or in comparison with other major causes of death.
Expected years of life lost
The tool also estimates expected years of life lost. For this calculation, I use life-table estimates of remaining life expectancy by age from (WHO, 2020).
Let $\text{life exp}_g$ denote the estimated remaining life expectancy for individuals in age group $g$. Then expected years of life lost are approximated by
\[\text{EYLL} = \sum_{g \in G} \mathbb{E} \left[ n(\text{deaths in age group } g) \right] \text{life exp}_g.\]This quantity gives a different perspective from total deaths, because deaths at different ages correspond to different expected numbers of remaining life years.
Actual years of life lost
The tool also includes a rough calculation of years of life lost from confirmed Covid-19 deaths. The first step is to estimate age-specific case fatality rates from available country-level estimates, as shown in Table 1.
| CFR | 0-9 | 10-19 | 20-29 | 30-39 | 40-49 | 50-59 | 60-69 | 70-79 | 80+ |
|---|---|---|---|---|---|---|---|---|---|
| China | 0.0 | 0.2 | 0.20 | 0.20 | 0.40 | 1.3 | 3.6 | 8.0 | 14.8 |
| Korea | 0.0 | 0.0 | 0.00 | 0.11 | 0.08 | 0.5 | 1.8 | 6.3 | 13.0 |
| Italy | 0.0 | 0.0 | 0.00 | 0.30 | 0.40 | 1.0 | 3.5 | 12.8 | 20.2 |
| Spain | 0.0 | 0.0 | 0.22 | 0.14 | 0.30 | 0.4 | 1.9 | 4.8 | 15.6 |
| Mean | 0.0 | 0.05 | 0.105 | 0.1875 | 0.295 | 0.8 | 2.7 | 7.975 | 15.9 |
Let $D$ be the event that a person died from Covid-19, and let $A_g$ be the event that this person’s age is in age group $g$. If a selected country has $n(\text{deaths})$ confirmed Covid-19 deaths, then years of life lost are estimated as
\[\text{YLL} = n(\text{deaths}) \sum_{g \in G} \Pr(A_g \mid D) \text{life exp}_g.\]The probability that a person who died was in age group $g$ is estimated by Bayes’ rule:
\[\Pr(A_g \mid D) = \frac{ \Pr(D \mid A_g) \Pr(A_g) }{ \Pr(D) }.\]Here,
\[\begin{aligned} \Pr(D \mid A_g) &= \text{estimated mean } \text{CFR}_g, \\ \Pr(A_g) &= \text{proportion of people in age group } g, \\ \Pr(D) &= \sum_{g \in G} \Pr(D \mid A_g) \Pr(A_g). \end{aligned}\]Country-level risk maps
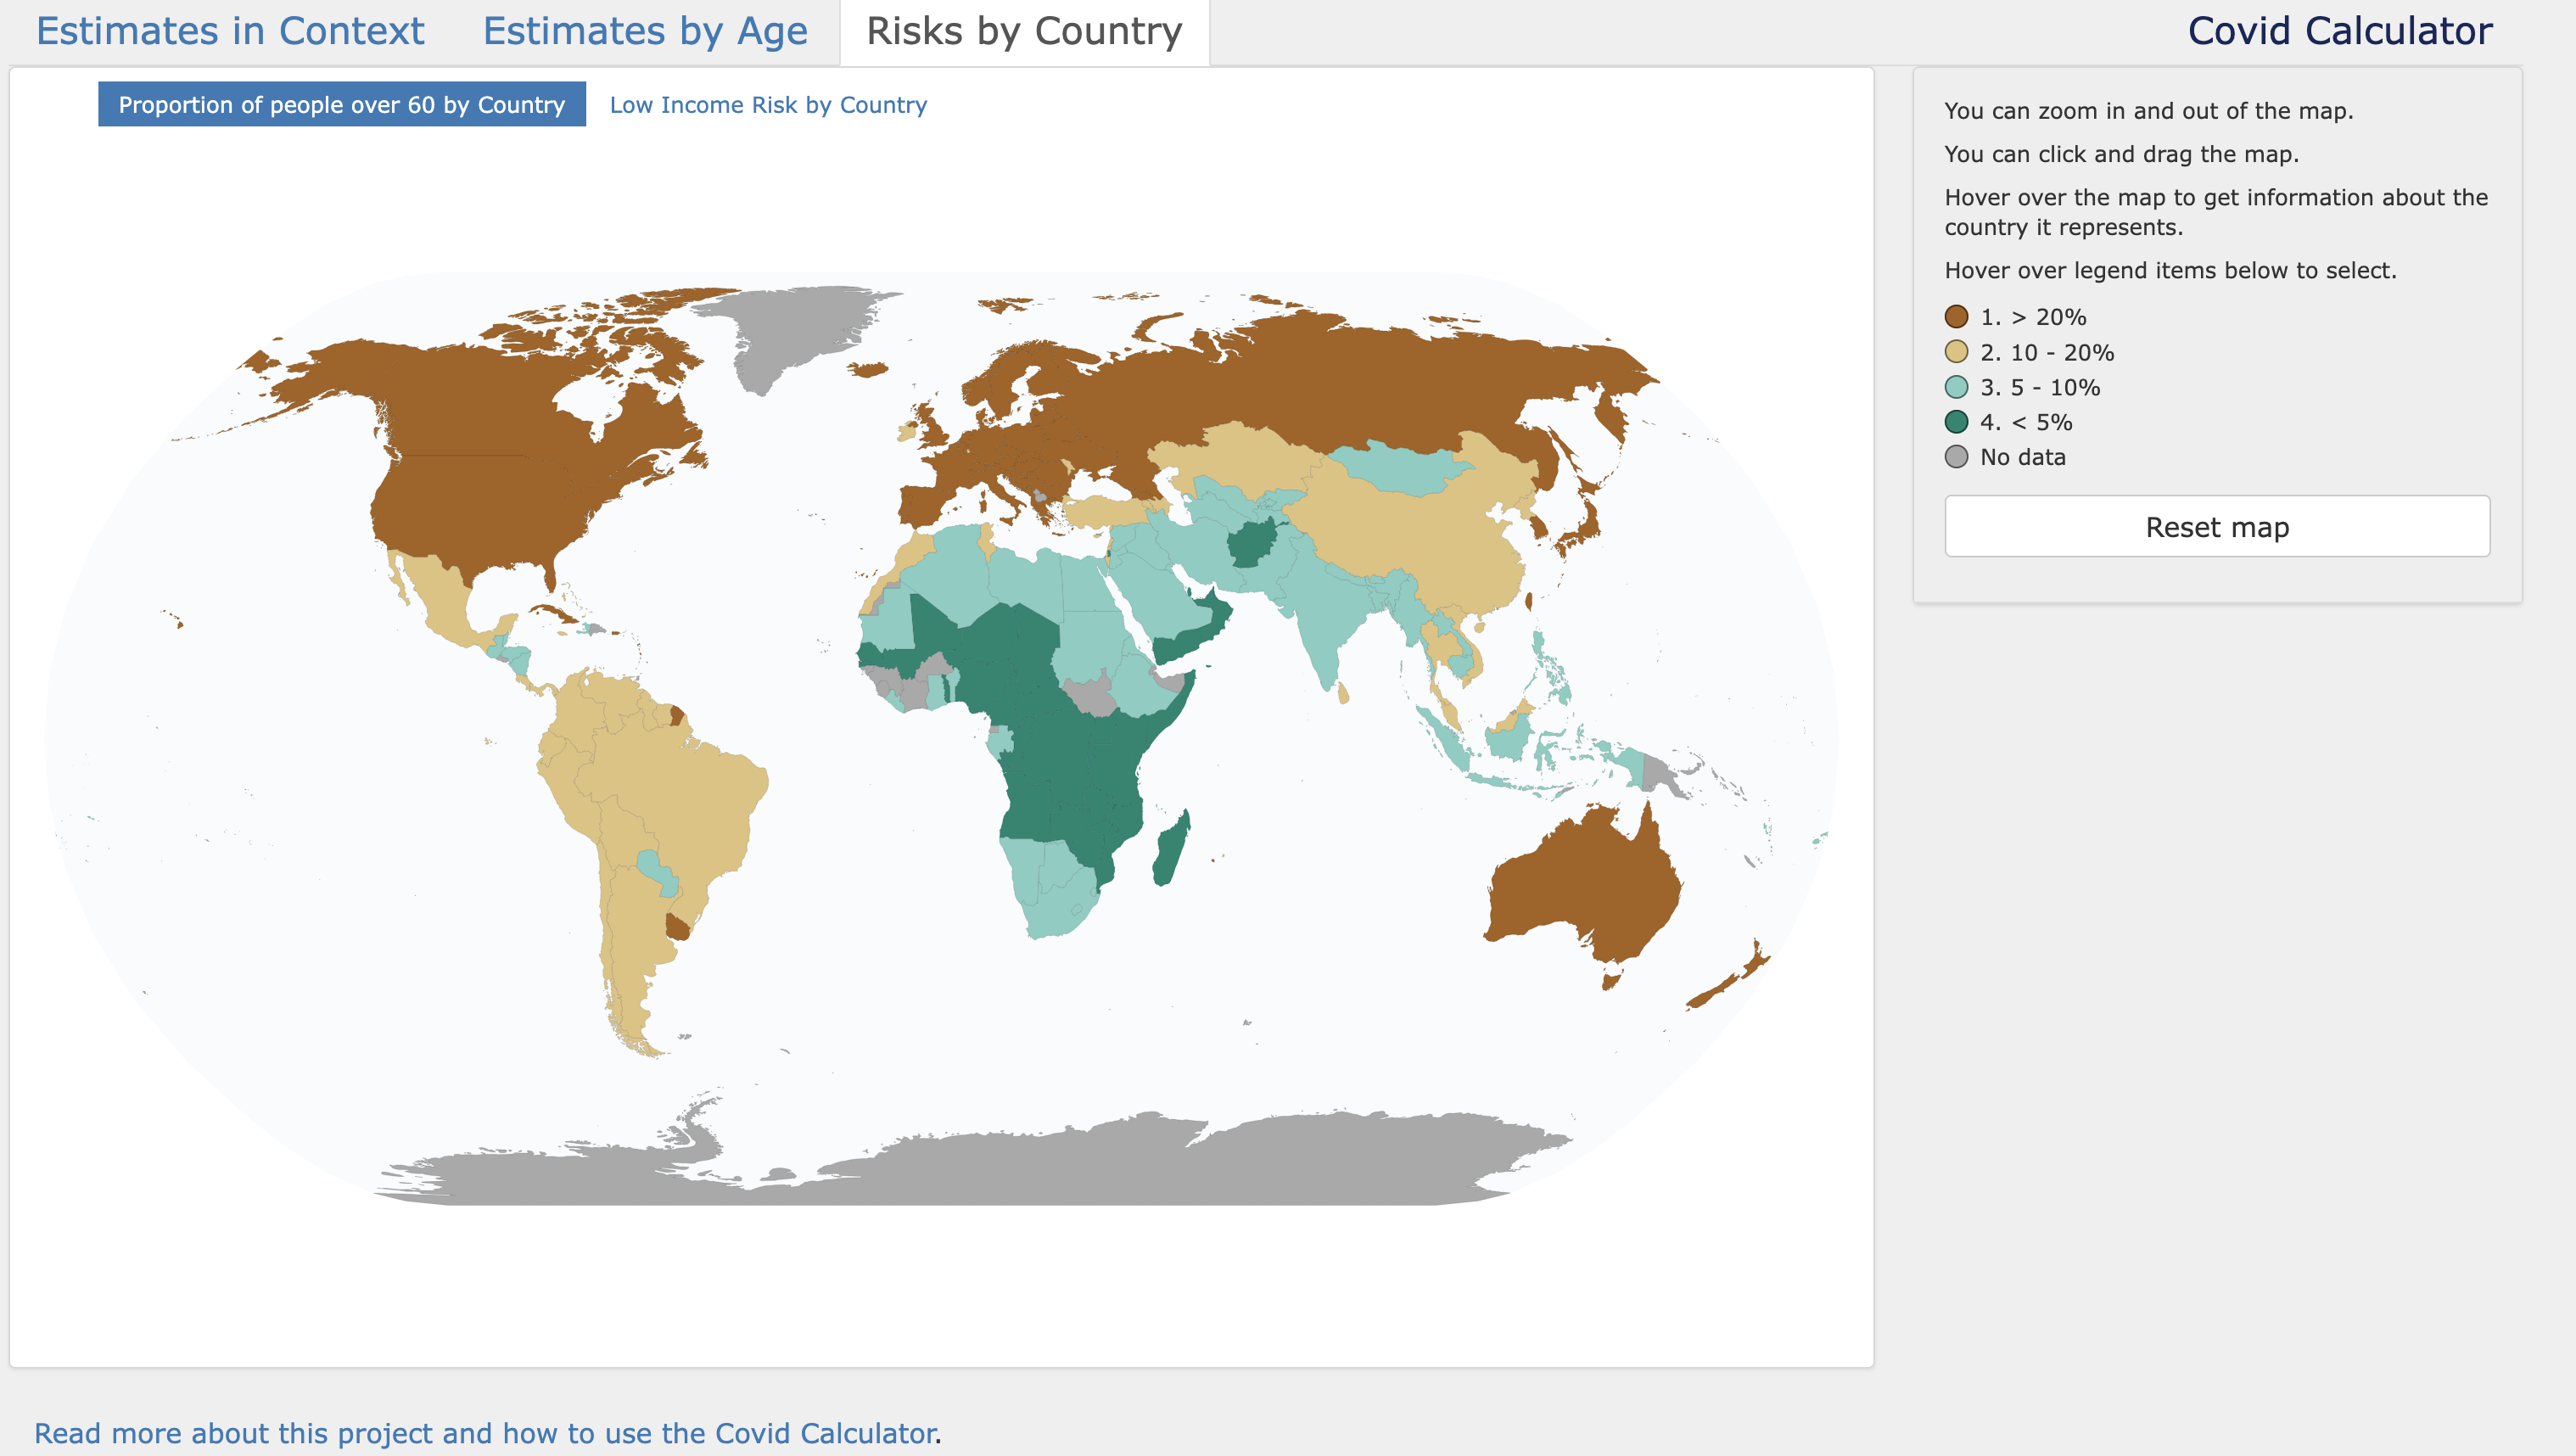
The map view shows simple country-level summaries. For example, one view shows the proportion of people over 60 by country, and another view shows a low-income risk measure. These maps are intended to provide context for why the same disease can have different expected consequences in different countries.
The map is interactive: users can zoom, drag, hover over countries, and select legend categories.
Projected costs
The tool includes a rough cost calculation based on a value of an additional quality-adjusted life year from (Staff, 2020). The estimate is obtained by multiplying years of life lost by this value.
This calculation is only meant to give an order-of-magnitude comparison. It should not be interpreted as a policy recommendation.
Projected poverty
The tool also included a simple poverty projection based on changes in IMF GDP growth forecasts (Fund, 2020) and World Bank estimates of extreme poverty (Bank, 2020).
This is a crude calculation. It does not model the economic effects of Covid-19 directly, and it does not separate the effect of the pandemic from other changes in economic forecasts. It is included as a simple way to visualize that the indirect effects of the pandemic can also be substantial.
Source code
The source code is available here:
References
- Pyramids, P. (2020). Population Pyramids of the World from 1950 to 2100. https://www.populationpyramid.net/
- N Ferguson, D. L., & et al., G. N. G. (2020). Report 9: Impact of non-pharmaceutical interventions (NPIs) to reduce COVID19 mortality and healthcare demand. https://doi.org/10.25561/77482
- WHO. (2020). Life tables. https://apps.who.int/gho/data/view.main.LIFEREGIONGLOBAL
- Staff, S. G. S. B. (2020). How much will we pay for a year of life? https://www.gsb.stanford.edu/insights/how-much-will-we-pay-year-life
- Fund, I. M. (2020). World Economic Outlook, April 2020: The Great Lockdown. https://www.imf.org/en/Publications/WEO/Issues/2020/04/14/weo-april-2020
- Bank, T. W. (2020). Poverty headcount ratio. https://data.worldbank.org/indicator/SI.POV.DDAY